Executive remuneration intelligence

Executive pay data,
ready to analyse.

Remlytica collects, extracts and curates executive remuneration reports into a structured, interactive platform — so you can evaluate how public companies pay and incentivise their leadership in minutes.

From report to insight in seconds

A live look at the FTSE all-share platform — what you can do with Remlytica.

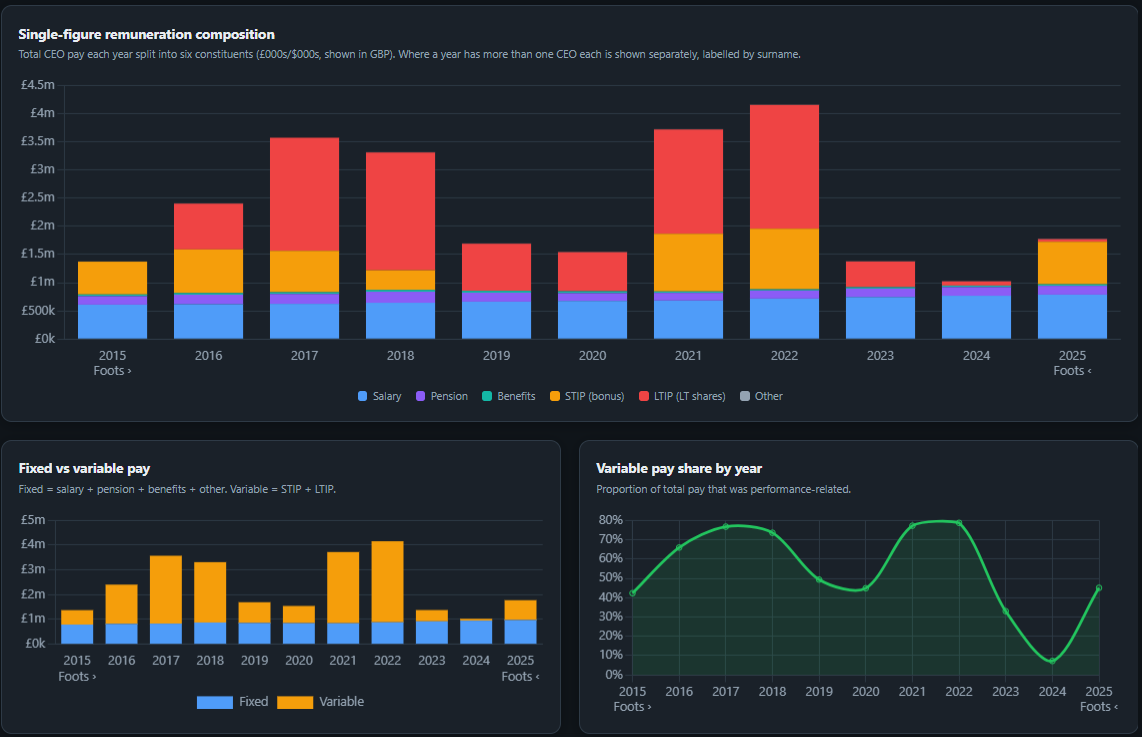
Breakdown pay

Pay breakdown — constituents — fixed vs variable

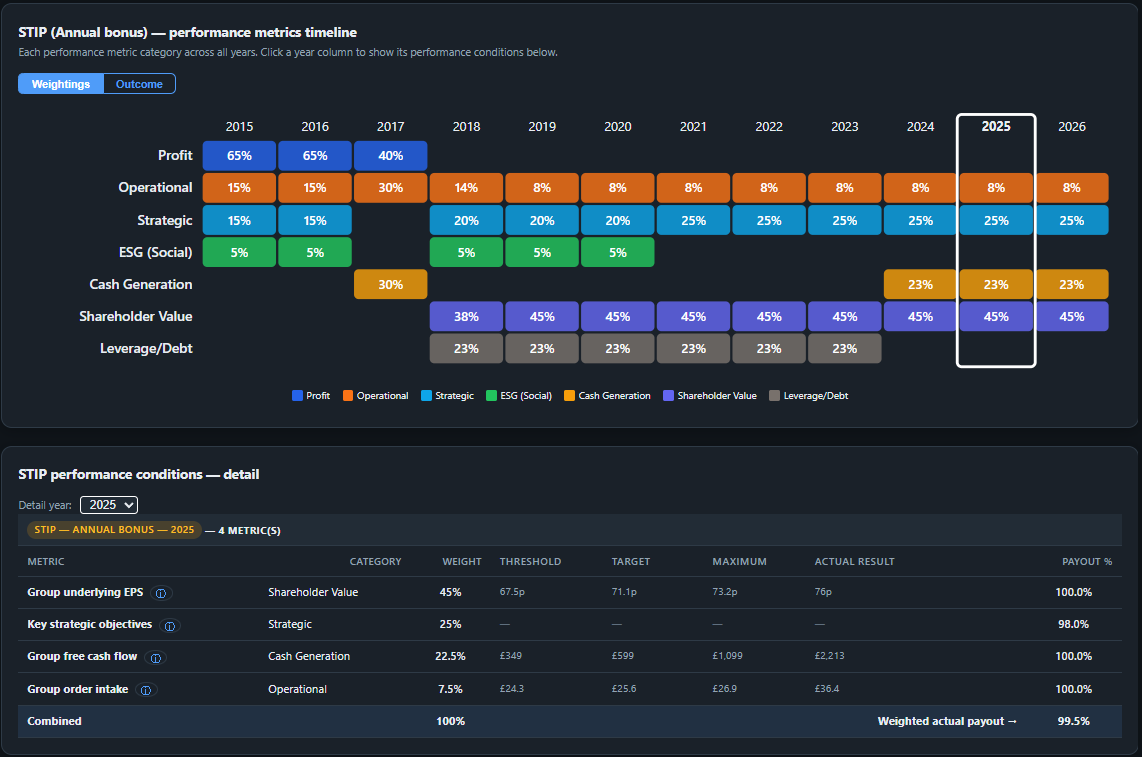
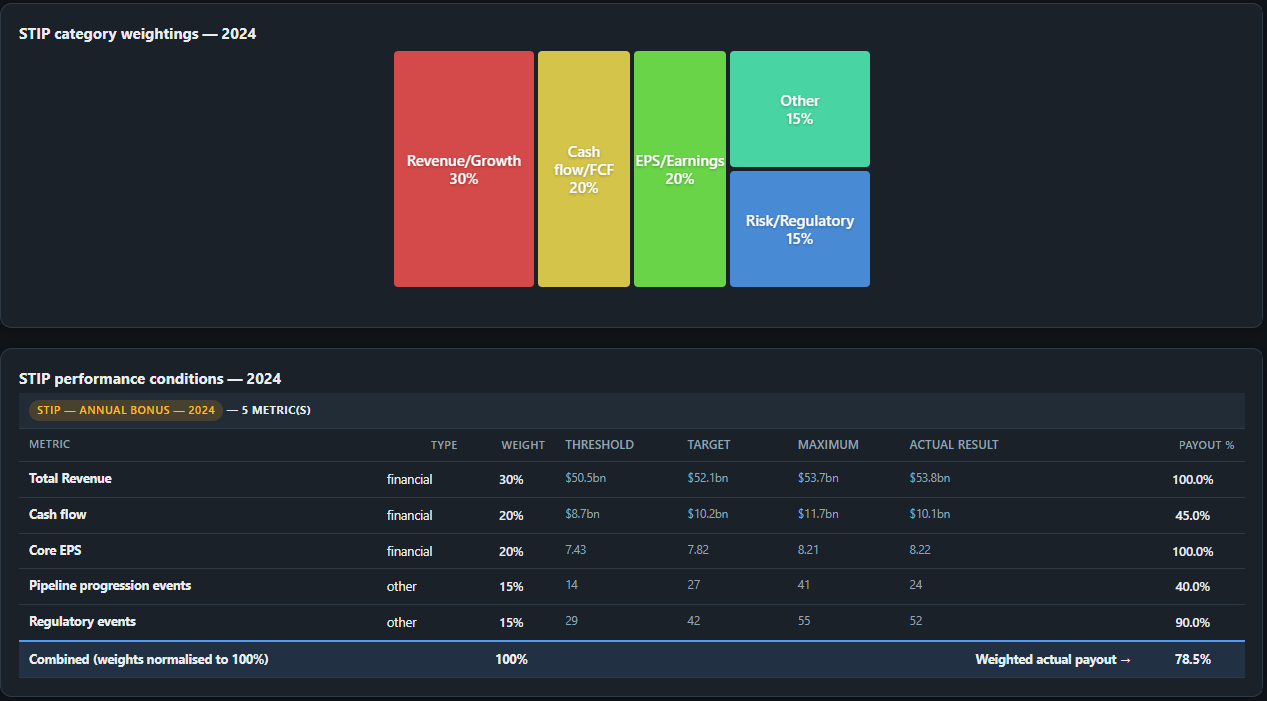
Analyse incentive structure for specific years...

STIP single year view

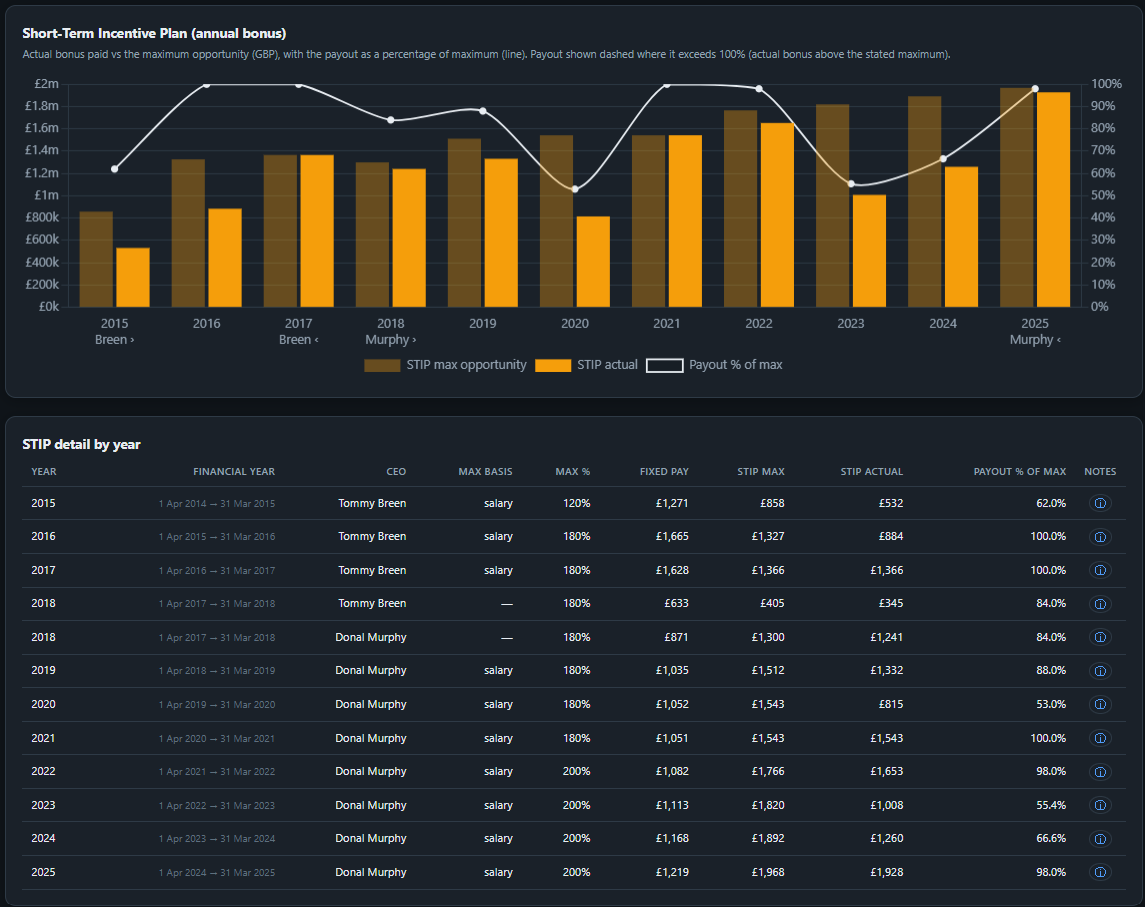
... Review changing incentives over time

STIP multiple year view

Check annual bonus payouts vs opportunities...

STIP outcome chart and table

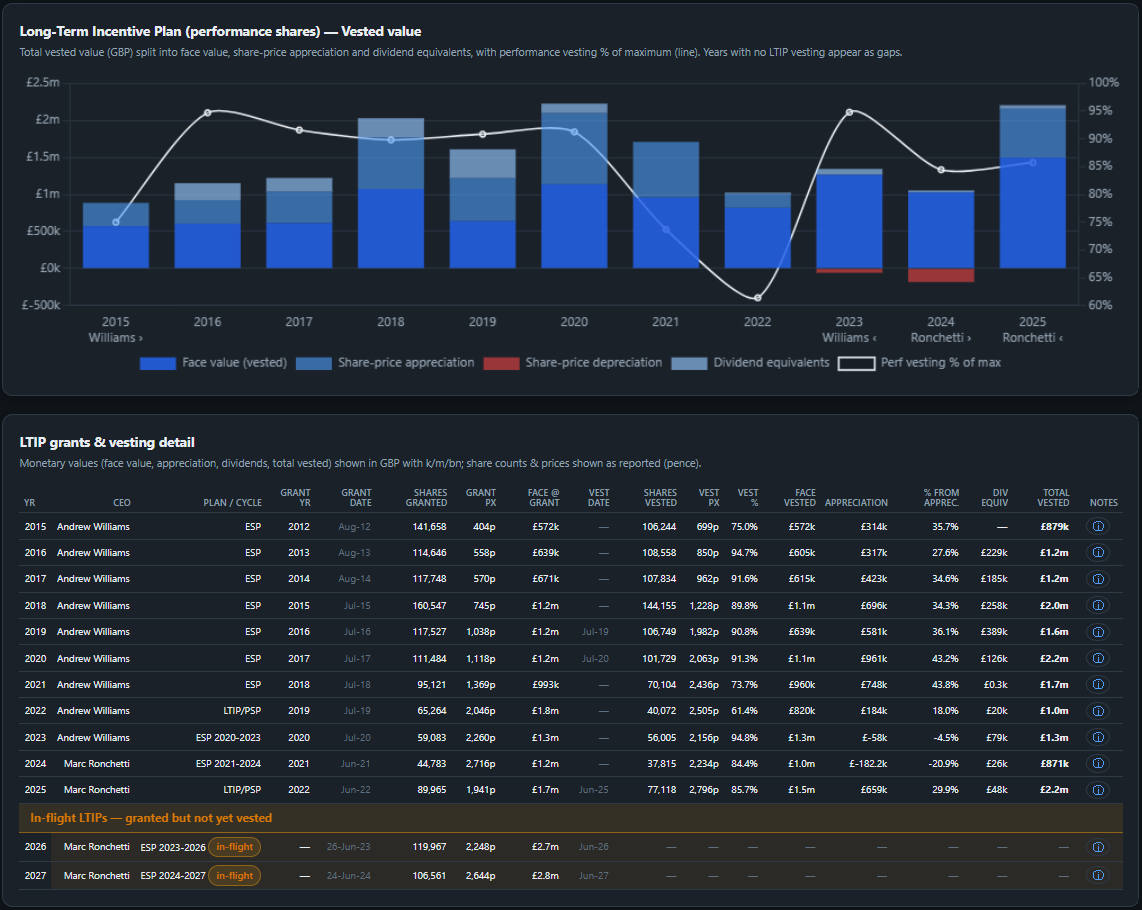
... And evaluate Long Term Incentive Plans

LTIP incentive outcomes

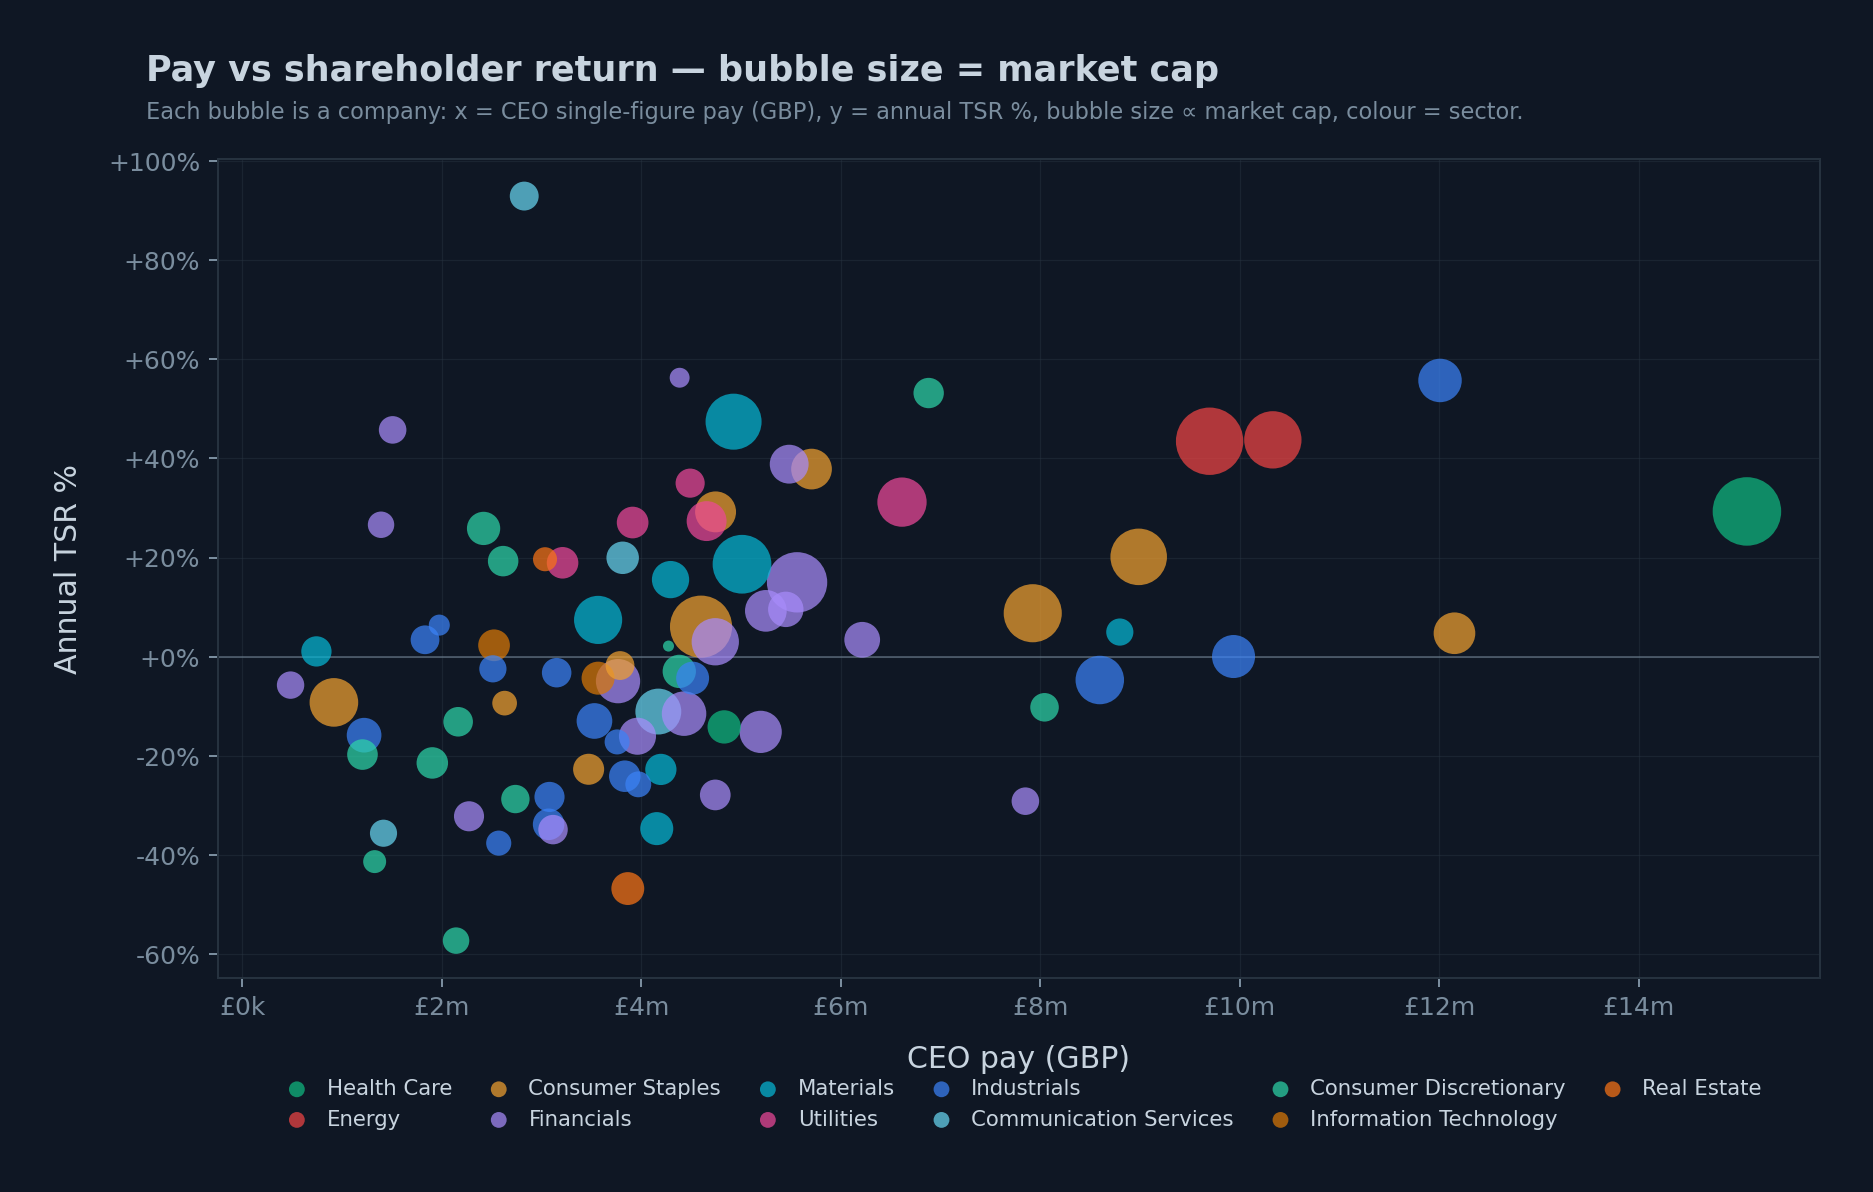
Compare CEO pay vs TSR across index, sector, or select peers

Pay vs shareholder return, bubble size = market cap

Check CEO alignment

3i value of CEO share interests (GBP)

Remuneration data is hard to work with

Investors and analysts know executive pay matters — but the data is buried in lengthy, inconsistent reports.

📄

Every report is different

Remuneration reporting varies with every company. Reading through annual remuneration reports is a real time cost — and focusing on a single year ignores the longer, company-specific remuneration history that gives it context.

Strategy-shaping, but time-constrained

Executive compensation and remuneration analytics shape company strategy. Most investors recognise this, but face real time constraints around properly investigating the data behind it.

🧩

Peer comparison is laborious

Companies often present a selected peer set for comparing performance — but actually investigating those peers and building like-for-like comparisons yourself is slow and manual.

Remlytica - designed by investors, for investors

We are a remuneration-data originator — we collect, extract and curate the data ourselves, so you can access the data you need and start analysing immediately.

📈

Separate signals from noise

We organise diverse company disclosure into a standardised and accessible database, where we show a standard ten years of compensation history, so you can track how remuneration incentives have changed (or remained the same) over time.

🎯

Incentives front and centre

We view performance incentives as fundamental to shaping company strategy. We capture STIP/LTIP design, metrics, weightings and outcomes in full across our coverage universe.

Common-size comparison & research

Remlytica facilitates common-size comparisons between companies with a range of comparison tools. Our proprietary research also highlights the most pertinent developments in compensation, remuneration and governance analytics.

Choose the level that fits

From individual analysts to enterprise research teams.

Pro

Pro

£250/month or £2,000/year
  • FTSE All-Share access + other indices once live
  • 10-year pay & incentive history
  • Proprietary research access
  • Full comparison & league tools
  • Performance-condition analytics
  • Data export
Learn more →
Enterprise

Enterprise

Custom pricing
  • Everything in Pro
  • API & bulk data delivery
  • Custom universes & peer sets
  • Onboarding & dedicated support
  • Flexible licensing
Contact us →

Designed by investors, for investors

How Remlytica compares to traditional remuneration-data providers. (Some fields left blank — to be finessed as the product evolves.)

Traditional providersFeatureRemlytica
Single-year snapshotsHistory depth10 years as standard
Pay totals onlyIncentive detailFull STIP / LTIP & performance conditions
Generic, supplied peer groupsPeer comparisonCommon-size comparison tools
Manual extraction from PDFsData accessImmediate, structured & interactive
CoverageFTSE All-share, S&P 500 (rolling out)
Opaque methodologySourcingTransparent, tied to audited reports
Governance & say-on-payIncluded
Bespoke / opaquePricingPro from £250/month; Enterprise custom
API & export

Frequently asked questions

Answers to common questions about the Remlytica platform.

Which companies and markets do you cover?
At present coverage extends across the FTSE All-Share, excluding investment trusts, private-equity funds, and externally-managed REITs. In active development we have S&P 500 and STOXX 600, and the longer-term pipeline includes TSX, ASX, and others.
How far back does the data go?
We collect a standard ten years of compensation history for every company, so you can analyse trends rather than a single year in isolation.
Where does the data come from and how is it sourced?
All figures are collected and curated from companies' audited Directors' Remuneration Reports and equivalent disclosures, on a consistent single-figure basis. (See our metrics & methodology section.)
How often is the data updated?
Coverage is extended as companies publish their annual reports and continuously curated. (Detailed update cadence to follow.)
What's included in each subscription tier?
Pro (£250/month or £2,000/year) includes full access to FTSE All-Share data plus other indices as they go live, 10-year pay and incentive history, comparison tools, performance-condition analytics, data export and proprietary research. Enterprise is custom-priced for institutions needing API access, bulk data delivery, custom universes and dedicated support.
Can I export the data or access it via API?
Export and API access are planned for higher tiers. Details to be confirmed.
Do you provide research and governance analytics?
Yes — our proprietary research highlights the most pertinent developments in compensation, remuneration and governance analytics. More detail to follow.
Start analysing executive pay today

Try the free trial, or get in touch about Pro and Enterprise access.